How to Read Schulte Table Progress Data
Learn what personal best, average, median, recent average, mistakes, and consistency mean in the Schulte Table Progress Tracker—and why each metric should stay within comparable task conditions.
By schulte-table.org editorial team ·
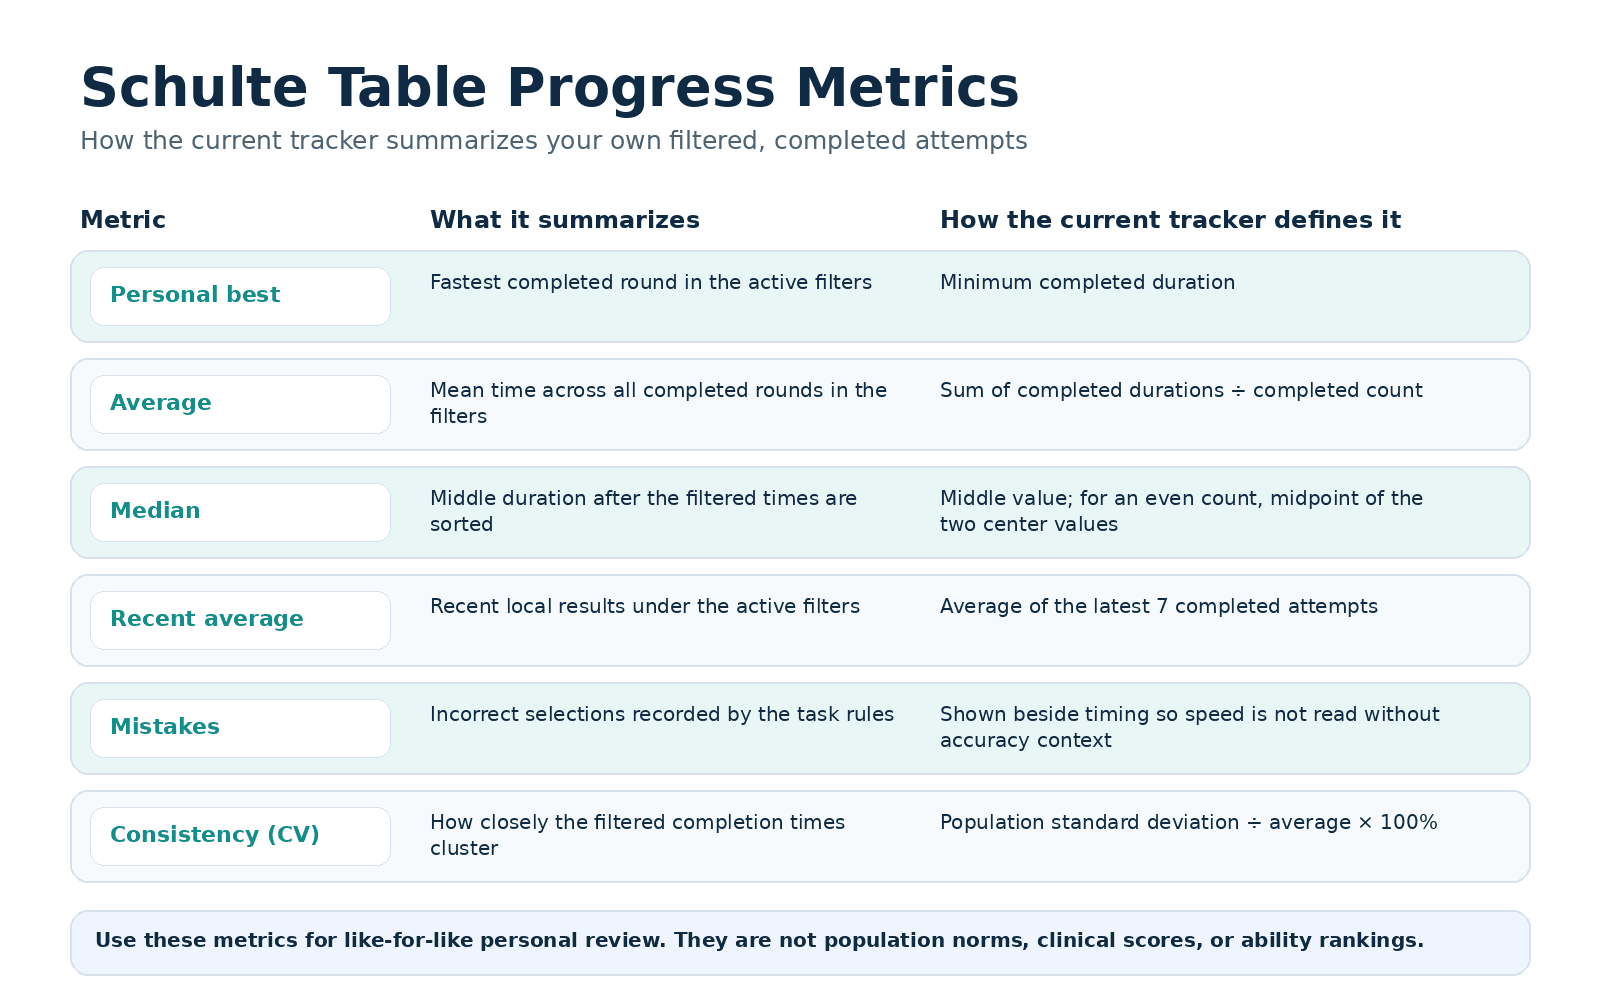
If you have several results, there is no single number that always deserves attention. The Progress Tracker describes the records selected by its filters. Personal best answers “what was the shortest completed duration?”, median describes the middle completed duration, average uses every completed duration, and recent average narrows the view to the latest seven completions.
Those summaries answer different questions, so disagreement among them is expected. The first check is not which card looks most favorable. It is whether the records behind the cards used the same grid, mode, input method, completion rule, and practical setup.
1. What each Tracker card actually calculates
The current Tracker applies its active filters first, then calculates duration metrics from completed records in that filtered set. Personal best is the minimum completed duration. Average is the sum of completed durations divided by their count. Median sorts those durations: an odd-sized set uses the middle item, while an even-sized set averages the two middle items.
Recent average uses up to the latest seven completed records. Records are stored and read newest first, so this is not a random sample and not the first seven ever recorded. Mistakes are incorrect selections already recorded by the originating task rules. The Tracker also displays average mistakes and the share of completed records with zero mistakes; it does not reinterpret what counted as an error in the source tool.
Consistency is the coefficient of variation for completed durations. The implementation uses population variance: it divides the squared deviations by the number of included durations, takes the square root, then divides by the mean. A smaller percentage means the selected times are closer together relative to their average. It says nothing about psychological stability or a person's attention outside this browser task.
mean = sum(completed durations) / completed count
CV = population standard deviation / mean × 100%
recent average = mean(latest 7 completed attempts)| Metric | What it summarizes | Useful for | Main limitation |
|---|---|---|---|
| Personal best | Fastest completed round in the filters | Remembering a shortest local attempt | Can be an outlier |
| Average | Mean of all filtered completed times | Locating the center of the whole included set | Sensitive to unusual rounds |
| Median | Middle filtered duration | A center less changed by one extreme value | Still depends on which records were included |
| Recent average | Latest 7 completed attempts | Reviewing recent local results | A small set can move quickly |
| Mistakes | Incorrect selections recorded by source rules | Keeping accuracy context next to time | Rules must match before comparison |
| Consistency (CV) | Relative spread of filtered durations | Seeing how tightly times cluster | Not a psychological measure |
2. Worked example: why best, median, and average differ
Take five comparable completed times: 31.2, 32.1, 31.8, 49.5, and 31.7 seconds. Sorting them gives 31.2, 31.7, 31.8, 32.1, 49.5. Personal best is therefore 31.2 seconds and the middle value is 31.8 seconds.
The total is 176.3 seconds, so the average is 176.3 ÷ 5 = 35.26 seconds. The 49.5-second round raises the average, but it does not change the median by the same amount. Using the Tracker's population formula, the standard deviation is about 7.1259 seconds and CV is about 20.21%. That relatively wide spread is a description of these five durations, not a reason to erase the slower one.
| Raw times | Personal best | Median | Average | Population CV |
|---|---|---|---|---|
| 31.2, 32.1, 31.8, 49.5, 31.7s | 31.2s | 31.8s | 35.26s | 20.21% |
3. Filters determine whether a summary is interpretable
The Tracker can filter by a preset or custom date range, grid size, mode, completion, and input method when that field exists in saved records. Its attempt-count card includes every filtered record, while duration summaries use only completed records. With “Completed only” selected by default, those counts are usually the same; turning it off can make them differ.
Select one grid size and one mode before treating a median or CV as a comparison series. A 3×3 round and a 10×10 round have different target counts. Standard ascending, descending, letter, red-black, and alternating number-letter records use different sequences. Mouse, touch, and keyboard activations create different interaction paths. Interrupted records should not be silently treated as completed durations.
The schema stores the fields as gridSize, mode, completed, durationMs, mistakes, and optional inputMethod, plus identifiers and timestamps. It does not store browser zoom, display scale, orientation, hint state, or every mode-specific option. If those details matter to your comparison, keep them stable or note them outside the Tracker.
- Same grid size
- Same mode and direction
- Same input method
- Same completion and error rules
- Comparable device, zoom, display scale, and orientation
- No unrecorded interruption
4. Why a best time is not a trend
Suppose the recent list is 34.0, 33.8, 34.2, 24.1, and 34.1 seconds. The 24.1-second entry becomes the personal best immediately, but the other four remain clustered around 34 seconds. The shortest entry may be a valid round. It may also involve a changed setup, a different input path, an interruption handled differently, or a record entered through the calculator with the wrong mode label.
Do not delete it merely because it is unusual, and do not call the full series improved merely because the minimum changed. Inspect the raw JSON or CSV record, its mistakes, mode, gridSize, inputMethod, and timestamp. Then check details the schema cannot hold, such as zoom and device. A trend requires the sequence of comparable observations, not only the most favorable endpoint.
The Tracker's “hide values beyond 3 standard deviations” option changes only the chart display. It does not remove the saved records or exclude them from summary cards.
5. Use exports to inspect, not to manufacture a cleaner story
CSV export writes the filtered records with columns for schemaVersion, id, completedAt, gridSize, cellCount, mode, durationMs, mistakes, completed, inputMethod, and challengeId. JSON export preserves a versioned wrapper, export time, and the full records. JSON import validates the schema, merges valid records with local history, and removes duplicate IDs.
An export is useful for checking the exact rows behind a summary or keeping a backup before deletion. It is not evidence that different tasks became comparable. If you split data into groups in a spreadsheet, use the same conditions that the Tracker filters represent and document any extra conditions you add manually.
6. What these data can and cannot support
The cards can describe shortest time, central values, recent values, recorded mistakes, and duration spread for the selected local task records. They can help you notice a questionable entry, compare two like-for-like personal sets, or decide that a setup change needs its own group.
They cannot diagnose a health condition, determine attention, assign intelligence, place a result in a population rank, or guarantee a transfer to reading or study. The site has no matched population dataset behind these cards. The safest reading remains literal: these are summaries of the current browser's included task records.