schultetable
Private browser tool

Schulte Table Progress Tracker

Review locally saved Schulte Table attempts without creating an account. Filter by date, grid size, mode, completion, and input method; then inspect time, mistakes, personal bests, medians, recent averages, and consistency. Trends remain separated by size so a longer grid is not mistaken for slower performance on a shorter one.

Your local progress

Filter records

No matching records yet. Complete a reverse or concentration grid, or explicitly save a result from the calculator.

Data operations

localStorage: schulte:attempts:v1

What the progress tracker records

Each unified record contains an anonymous stable ID, ISO completion time, grid size, cell count, practice mode, duration, mistakes, completion state, and an optional broad input method. It does not contain a name, email, IP address, or device fingerprint. Challenge records may include a local challenge identifier.

Best time, average, and median

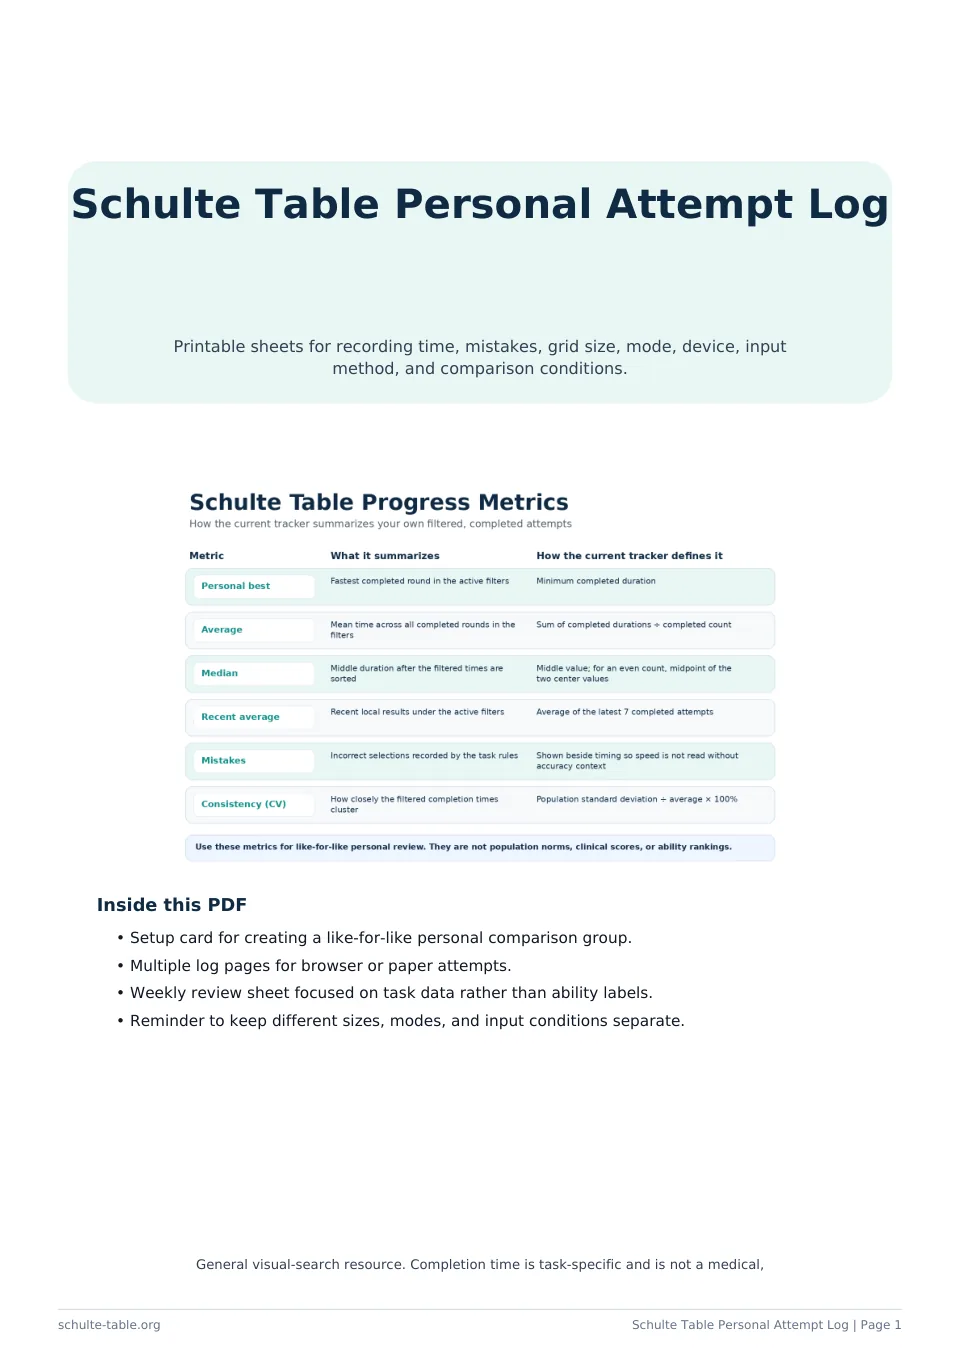
Personal best is the shortest completed duration in the current filters. Average uses every completed duration and can move noticeably after one unusual result. Median is the middle duration after sorting, so it is often useful beside the average. Recent average uses the latest seven completed attempts.

Why grid sizes stay separate

A 10×10 grid has many more targets than a 3×3 grid, so total durations are not directly interchangeable. Select one size before reading a trend line. Summary cards follow the active filters, while the chart groups series by grid size and labels each group instead of deriving one overall performance claim.

How mistakes affect interpretation

A fast attempt with several wrong selections is not equivalent to an accurate attempt. The tracker shows average mistakes and an accuracy proxy: the share of completed attempts with zero recorded mistakes. This is a plain practice summary, not a sensory, cognitive, or medical assessment.

What consistency means here

Consistency is the coefficient of variation for completed durations: population standard deviation divided by the average. A smaller percentage means the filtered times are closer together. It describes only the spread of your saved practice times and should not be interpreted as psychological or medical stability.

Exporting, importing, and deleting

CSV is convenient for a spreadsheet; JSON preserves the full schema for backup and re-import. Import validates every item and removes duplicate IDs. Delete filtered records or all records only through the confirmation dialog. Export a backup first if the local history matters to you.

Limits of timing comparisons

Screen size, pointer type, keyboard use, interruptions, browser load, grid mode, and familiarity can change a result. Compare like with like and look across several rounds. Hiding statistical outliers changes only the chart view; it never silently deletes the underlying records.

FAQ

Where is tracker data stored?+

It is stored under a versioned localStorage key in this browser and is not synced to an account.

How is consistency calculated?+

It is the population standard deviation of completed times divided by their average, displayed as a percentage.

Does importing overwrite my history?+

No. Valid imported records are merged with current records, and matching IDs are kept only once.

Can I compare different grid sizes?+

You can inspect them as separate groups, but total time should not be treated as directly comparable across sizes.